

Dispersion in a Single Line LOV
Sample/Reagent Overlap
2.2.6.C.
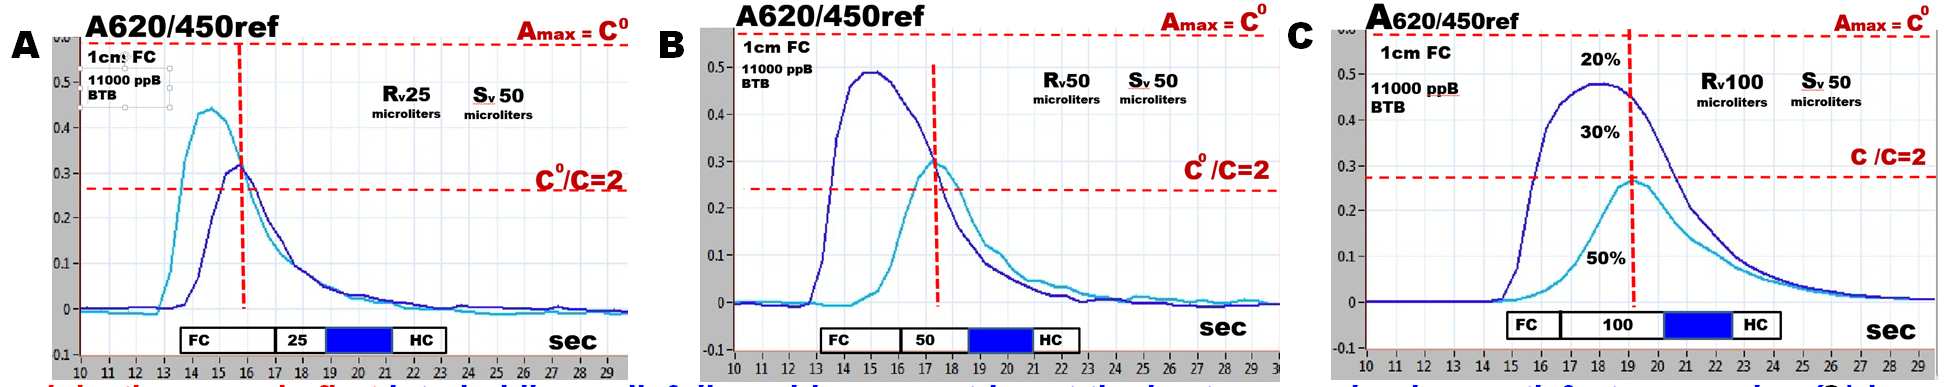
Two experiments are shown superimposed on each panel, 1) injections of sample (BTB dye)) and reagent (colorless) representing sample, and 2) injections of sample (dye) and reagent (dye) representing sample + reagent mixture. By using the same dye concentration in all experiments injected into a colorless carrier solution, the volumetric ratios of sample, reagent and carrier are visualized for single reagent and sandwich sequences.


Injecting sample first into holding coil, followed by reagent is not the best approach, since satisfactory overlap (C) is obtained only when reagent volume is increased to 100 microliters, yielding volumetric ratios of S 50%, R 30%, C 20%.
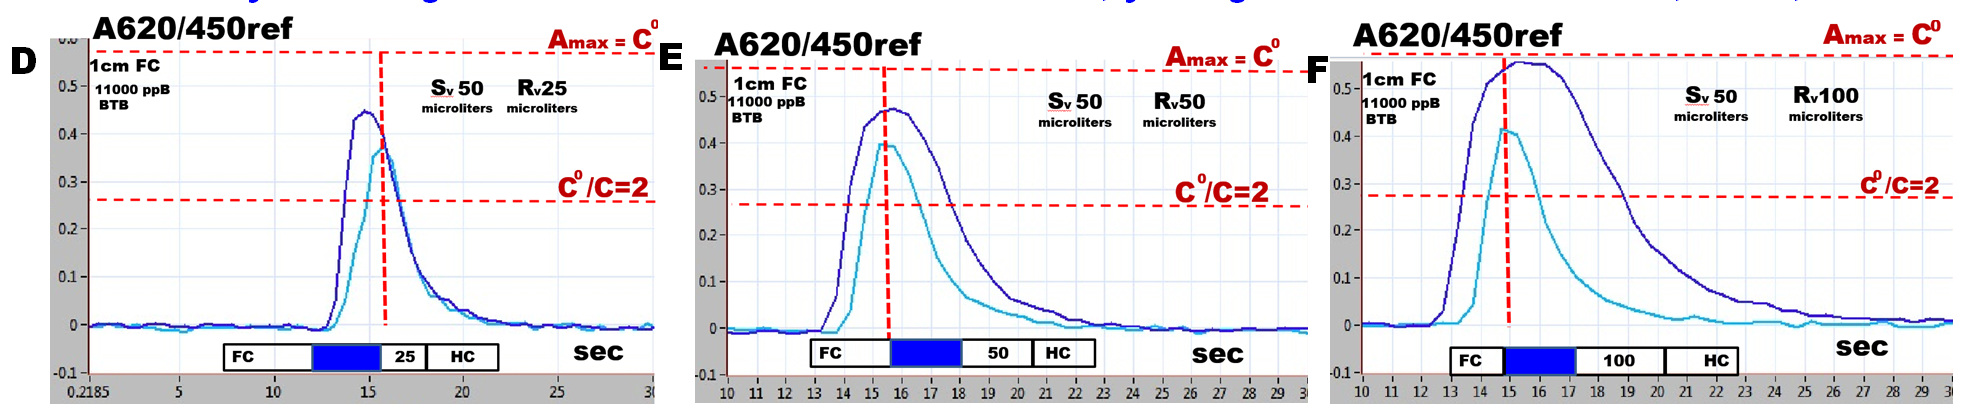
Injecting reagent first into holding coil, followed by sample is preferable, since satisfactory overlap is obtained already when Sv=Rv (E)and the volumetric ratios at sample peak maximum are higher percentages for both S and R.
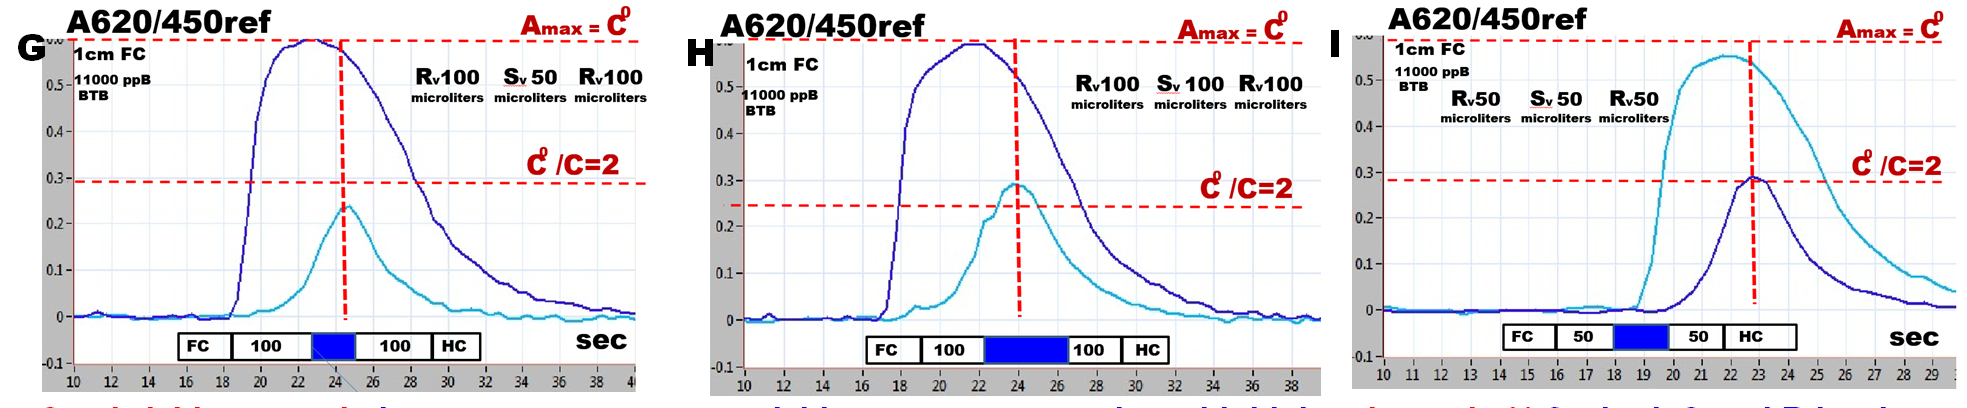
Sandwiching sample between reagent zones yields a generous overlap with high volumetric % for both S and R leaving no or only a little room for C at peak maximum. Compare panels H and I for similarity and injected S, R volumes.
NOTE: Concentration of reagents used for real life assays are often 100 to 1000 times higher than concentrations of target analytes. Thus e.g. for analysis of phosphate (2.2.25.) at ppM P level 3% ascorbic acid and 0.5% ammonium molybdate is used. Since the experiments shown here show volumetric ratios (by using equal concentrations of dye for S and R), the reagent excess in concentration ratios for real life assays will be many times higher than visualized here. However, when designing R and S sequence and volumes, configurations shown on panels C,F,G,H,I , would still be preferable to those shown on panels A,B,D,E. .